

You notice it every July and January. The thermostat clicks on more often, the electric bill climbs, and the grid hums a little louder. But the connection between outdoor temperature and energy demand isn’t just about comfort — it’s a physical relationship that shapes power markets, fuel prices, and the reliability of the entire electricity system.
This article walks through the mechanics of that relationship, using real data from 2026 heatwaves to show what happens when temperature anomalies push the grid to its limits. You’ll learn how heating degree days and cooling degree days work, why cooling demand now outpaces heating in many regions, and what utilities, policymakers, and homeowners can do to adapt. We’ll also look at the hidden costs — the industries that suffer when temperature swings hit, and the communities that bear the heaviest burden.
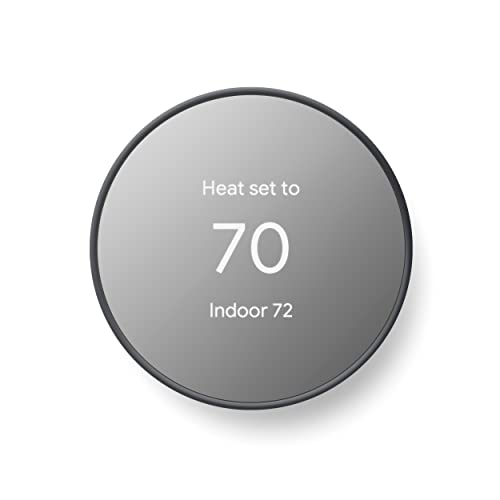
Google Nest Thermostat - Smart Thermostat for…
- ENERGY STAR certified smart thermostat for home that helps you save energy and stay comfortable.Connectivity : Wi-Fi - 802.11b/g/n…
- The Nest Thermostat is designed to work without a C wire in most homes, but for some systems, including heating only, cooling only…
- Nest Thermostat turns itself down when you leave, so you don’t waste energy heating or cooling an empty home. Lock feature: No
If you’re managing energy costs at home, a smart thermostat like the Google Nest Thermostat can automatically adjust your schedule based on your habits and local weather patterns, which helps smooth out the demand spikes we’ll discuss. It’s a small step, but it’s the kind of demand-side flexibility the grid increasingly needs.

The Invisible Hand of Temperature on the Grid
Temperature doesn’t directly turn on power plants. But it drives the behavior of millions of buildings, and those buildings collectively dictate how much electricity the grid must supply at any given moment. When a cold front sweeps through the Midwest, electric resistance heaters and heat pumps kick on across thousands of homes. When a heat dome settles over the Southwest, air conditioners run longer and harder. The result is a demand curve that tracks the thermometer with remarkable consistency.
Grid operators watch weather forecasts as carefully as they watch generation capacity. A 5°F deviation from normal can shift peak load by several gigawatts — enough to require firing up expensive peaker plants or, in extreme cases, calling for rolling blackouts. The relationship isn’t linear, either. Each additional degree of temperature deviation creates a larger demand response than the last, especially at the extremes.
That’s why understanding how temperature shifts drive energy demand changes matters for more than just your monthly bill. It’s the foundation of grid resilience, energy planning, and the transition to a decarbonized power sector.
Beyond the Thermostat: Why Heating and Cooling Loads Dominate
Residential and commercial buildings account for roughly 40% of total electricity consumption in most developed nations. Within that share, space heating and cooling represent the single largest end-use. In the United States, heating and cooling together make up about 45% of a typical home’s energy use. That’s why temperature shifts have such an outsized effect on the grid — they directly modulate the biggest chunk of demand.
The Physics of Demand: HDD and CDD Explained
Energy analysts use two standard metrics to quantify this relationship: heating degree days (HDD) and cooling degree days (CDD). A degree day is calculated by taking the average of a day’s high and low temperature and comparing it to a baseline — typically 65°F, the temperature at which most buildings need neither heating nor cooling.
If the day’s average temperature is 50°F, that’s 15 heating degree days. If it’s 80°F, that’s 15 cooling degree days. Sum those daily values over a month or a season, and you get a reliable predictor of energy consumption. A month with 500 HDD will require significantly more heating fuel than a month with 200 HDD, regardless of what the calendar says.
The baseline isn’t universal. Commercial buildings with high internal heat gains from equipment and occupants might need cooling at 55°F. A well-insulated passive house might not need heating until the outdoor temperature drops below 45°F. But the 65°F baseline works well enough for regional comparisons and long-term trend analysis.
What matters for grid planning is the rate of change. A gradual cooling trend over several weeks gives utilities time to prepare. A sudden 20°F drop overnight creates a demand spike that stresses everything from natural gas pipelines to transformer capacity.
The Tipping Point: When Cooling Outpaces Heating
For most of the 20th century, winter heating drove peak electricity demand in temperate regions. That’s shifted. Air conditioning penetration has risen dramatically in warmer climates, and climate change has pushed summer temperatures higher. In the United States, summer peak demand now exceeds winter peak in most regions. The trend is even more pronounced in rapidly developing countries like India and Indonesia, where cooling demand is growing at 10-15% per year.
The physics of cooling make this particularly challenging. Heating can be achieved with high-efficiency heat pumps or even direct combustion. Cooling requires electricity — there’s no such thing as a natural gas-powered air conditioner that doesn’t use a compressor. As global temperatures rise, the world’s electricity demand becomes increasingly dependent on cooling loads, and those loads peak precisely when solar generation starts to decline in the late afternoon.
This is the temperature-driven demand shift that keeps grid operators up at night. It’s not just that it’s getting hotter; it’s that the hottest hours coincide with the most constrained part of the daily generation cycle.
The 2026 Case Study: Heatwaves as a Preview of the Future
Summer 2026 offered a stark preview of what a warming world means for electricity demand. A series of intense heatwaves swept across North America, Europe, and Asia, pushing temperatures 5-10°F above historical norms for weeks at a time. The energy data from those events, analyzed by organizations like Ember, tells a clear story: cooling demand surged, fossil fuel generation spiked, and electricity prices followed.
In Texas, the ERCOT grid set multiple all-time demand records in August 2026, peaking at over 85 GW. That’s roughly 10 GW higher than the previous record set in 2026. The margin between available supply and demand narrowed to less than 2% on the hottest afternoons, forcing the grid operator to issue conservation appeals and pay emergency prices exceeding $5,000 per megawatt-hour — more than 100 times the typical wholesale price.
Similar patterns emerged across Europe. Spain and Greece saw record electricity demand during late July heatwaves, with air conditioning loads driving consumption up 15-20% above seasonal averages. In China, the province of Sichuan — heavily dependent on hydroelectric power — faced rolling blackouts as drought reduced reservoir levels just as cooling demand peaked.
The common thread: temperature anomalies don’t just increase demand. They increase the volatility of demand, making it harder for grid operators to forecast and prepare.
The Coal Comeback: How Fossil Fuels Filled the Gap
Here’s the uncomfortable part. During the 2026 heatwaves, coal generation rose in several markets that had been actively retiring coal plants. In the United States, coal-fired generation increased 8% in August 2026 compared to the same month in 2026, despite the long-term trend toward coal phase-out. The reason is simple: when demand spikes, the grid needs dispatchable generation that can ramp up quickly. Natural gas and coal are the only resources that can reliably do that at scale.
Renewables helped, but they weren’t enough. Solar generation peaks at midday, which aligns well with cooling demand. But the demand peak often extends well into the evening, after solar output has dropped to near zero. Wind generation was below average during several of the most extreme heat events due to stagnant high-pressure systems. Battery storage helped in some regions but remains far too small to cover multi-hour evening peaks.
This is the tension at the heart of decarbonization. The grid is getting cleaner on average, but the marginal generation — the plants that fire up when demand exceeds baseload — is still predominantly fossil. Every heatwave exposes this vulnerability.
The Price of Discomfort: Economic Strain on Energy Markets
The economic impact of heat-driven demand spikes goes far beyond the wholesale price of electricity. When the grid is stressed, costs cascade through the economy.
First, there’s the direct cost of generation. Peaker plants are expensive to operate, and their fuel costs get passed to consumers. During the August 2026 Texas heatwave, residential customers on variable-rate plans saw bills triple or quadruple compared to the previous month. Some faced charges exceeding $400 for a single week.
Second, there’s the cost of infrastructure stress. Transformers and distribution lines degrade faster when operated at or above rated capacity. The heat itself compounds the problem — electrical resistance increases with temperature, so the same current flow produces more heat loss in the wires. Utilities in several states reported a 20-30% increase in transformer failures during extreme heat events.
Third, there are the indirect costs of electricity demand spikes on businesses. Manufacturing plants that face demand charges based on their peak 15-minute usage can see their power bills double. Cold storage facilities must run compressors harder, increasing both electricity consumption and equipment wear. Even data centers, which are relatively insulated from temperature swings, face higher cooling costs and the risk of service degradation during grid emergencies.
The total economic cost of the 2026 heatwaves is still being tallied, but early estimates from energy economists put the figure in the tens of billions of dollars across the affected regions. That’s not just the cost of electricity — it’s the cost of lost productivity, spoiled food, damaged equipment, and the health impacts of heat exposure in homes that couldn’t afford to run their AC.
The Hidden Victims: Industry, Transport, and Agriculture
Residential and commercial buildings get most of the attention in discussions of temperature-driven energy demand. But they’re not the only sectors affected. The energy demand changes triggered by temperature shifts ripple through the entire economy.
Agriculture is particularly vulnerable. Irrigation pumps run longer during heatwaves to compensate for increased evapotranspiration. Grain dryers consume large amounts of natural gas or electricity when harvests arrive early due to warm weather. Dairy farms see reduced milk production when cows are heat-stressed, and the cooling systems used to mitigate that stress add to the farm’s electrical load. In California’s Central Valley, agricultural electricity demand during the 2026 heatwave was 12% above the five-year average.
Transportation has a more complex relationship with temperature. Electric vehicle range drops by 10-20% in extreme cold, which means more frequent charging. In extreme heat, cabin cooling loads increase, and battery thermal management systems work harder. Rail networks face speed restrictions when track temperatures exceed 120°F, forcing freight to be rerouted or delayed. Aviation fuel consumption increases in hot weather because air density decreases, requiring more thrust for takeoff.
Industrial processes are also temperature-sensitive. Natural gas pipelines lose capacity when compressors struggle in high heat. Refineries and chemical plants reduce throughput during heatwaves to avoid equipment failures. Steel mills, aluminum smelters, and glass manufacturers all require precise temperature control — and their cooling systems consume massive amounts of electricity when ambient temperatures rise.
The common theme is that these sectors don’t show up in the residential load curve, but they contribute to the same grid stress. A comprehensive temperature and energy consumption analysis must account for all of them.
The Grid of Tomorrow: Adaptation Strategies for a Warmer World
Reactive responses to temperature-driven demand spikes — emergency conservation appeals, rolling blackouts, price gouging — are not a sustainable strategy. The grid needs structural changes to handle a future with more extreme temperature events. Here’s what that looks like in practice.
Demand Response and Dynamic Pricing
Demand response programs pay customers to reduce consumption during peak periods. They’ve existed for decades, but they’re becoming more sophisticated. Instead of asking customers to simply turn off appliances, modern programs use smart thermostats, EV chargers, and water heaters to automatically shed load for short periods without noticeable comfort impacts.
The key is price signals. When electricity costs $5 per kWh during a heatwave peak, a customer with a smart thermostat might save $50 in a single afternoon by pre-cooling their home in the morning and letting it drift a few degrees in the late afternoon. That’s a meaningful incentive. The challenge is that most residential customers are on flat-rate plans that don’t reflect real-time grid conditions.
Dynamic pricing — where the retail rate varies by hour based on wholesale costs — is the most direct way to align consumer behavior with grid needs. States like California and Texas have piloted these programs, and the results are encouraging. Customers on dynamic rates reduce their peak demand by 10-20% on average, and the savings are largest during the most extreme events.
However, dynamic pricing has equity implications. Low-income households may not have the flexibility to shift their energy use, and they’re more likely to be on the wrong side of a price spike. Any serious rollout of dynamic pricing needs to include protections for vulnerable customers.
The Storage Solution: Buffering the Volatility
Battery storage is the most versatile tool for managing temperature-driven demand volatility. A 100 MW battery can charge during the midday solar peak and discharge during the evening cooling peak, effectively shifting renewable energy to the hours when it’s needed most. This doesn’t just reduce fossil fuel generation — it also reduces the need for expensive peaker plants and grid infrastructure upgrades.
The economics of storage have improved dramatically. Utility-scale battery costs have fallen by over 70% since 2026, and many projects now pencil out without subsidies. The United States installed more than 10 GW of utility-scale battery storage in 2026, bringing the total to over 30 GW. That’s still small compared to peak demand — the country needs roughly 200 GW to fully cover evening peaks — but the growth trend is promising.
Thermal energy storage is another option that receives less attention. Ice storage systems freeze water at night when electricity is cheap, then use the ice to cool buildings during the day. This shifts cooling load without requiring the building to compromise on comfort. Several large commercial buildings in Phoenix and Dubai have installed these systems, and they’ve cut peak cooling demand by 30-40%.
Distributed storage — batteries in homes and businesses — is also growing. Combined with smart thermostats, a home battery can run the AC for several hours during a grid emergency without drawing from the grid. The temperature regulation and renewable energy connection is central here: storage and smart controls make it possible to rely on solar and wind without sacrificing reliability during temperature extremes.
The Equity Gap: Who Bears the Cost of Climate-Driven Demand?
It’s not a coincidence that the communities most exposed to heat-driven demand spikes are also the ones least able to absorb the cost. Low-income neighborhoods tend to have older, less efficient buildings, more heat-absorbing surfaces, and less tree cover. They also have a higher percentage of residents who can’t afford to run their AC at all.
The data is stark. A study by the American Council for an Energy-Efficient Economy found that low-income households spend 8-10% of their income on energy, compared to 2-3% for higher-income households. During a heatwave, that percentage can balloon to 20% or more. The result is a cruel choice: pay the electric bill or buy groceries.
The health consequences follow the same pattern. Heat-related mortality is concentrated in neighborhoods with poor housing stock and limited access to air conditioning. During the 2026 heatwaves, emergency room visits for heat exhaustion were 50% higher in low-income ZIP codes than in affluent ones.
Developing nations face an even more acute version of this problem. Countries like India, Nigeria, and Bangladesh are experiencing rapid growth in cooling demand, but their grids lack the capacity and resilience to handle it. Rolling blackouts during heatwaves are common, and the people who suffer most are those who can’t afford backup generators or solar panels.
The climate-driven energy demand crisis is fundamentally an equity crisis. Any adaptation strategy that ignores this dimension will fail the people who need it most. That means targeted efficiency programs for low-income housing, subsidized smart thermostats and efficient AC units, and grid investments in underserved communities.
From Reactive to Proactive Energy Planning
The evidence is clear: temperature shifts are no longer a predictable seasonal pattern. They’re becoming more extreme, more frequent, and more disruptive. The grid that was designed for a stable climate is now operating in conditions it wasn’t built for, and the strain shows up in every dimension — reliability, cost, and equity.
But there’s reason for optimism. The tools to adapt exist. Dynamic pricing, battery storage, smart thermostats, and building efficiency improvements can all reduce the impact of temperature-driven demand spikes. The challenge is deploying them at the speed and scale required.
For homeowners, the practical steps are straightforward: improve insulation, upgrade to efficient equipment, and use a programmable or smart thermostat to shift energy use away from peak hours. The home temperature optimization guide on this site covers those steps in detail.
For utilities and policymakers, the path is more complex but equally clear. Invest in storage and transmission, reform electricity pricing to reflect real-time costs, and target efficiency programs at the communities that need them most. The cost of inaction — measured in blackouts, price spikes, and heat-related deaths — is far higher than the cost of adaptation.
Understanding how temperature shifts drive energy demand changes is the first step. Acting on that understanding is the second. The grid of the future will be shaped by how well we manage the relationship between weather and electricity. We have the data, the technology, and the economic incentives. What remains to be seen is whether we have the will.
Practical Comparison: Responding to Temperature-Driven Demand
| Strategy | Best For | Response Speed | Cost to Implement | Key Limitation |
|---|---|---|---|---|
| Demand Response Programs | Utilities with peak load issues | Minutes to hours | Low to medium | Requires customer enrollment and automated controls |
| Dynamic Pricing | Residential and small commercial | Immediate | Low (software changes) | Equity concerns for vulnerable households |
| Utility-Scale Battery Storage | Grid operators | Milliseconds to seconds | High | Limited duration (typically 2-4 hours) |
| Smart Thermostats | Homeowners and small businesses | Minutes | Low ($100-$250 per unit) | Requires user adoption and compatible HVAC |
| Building Efficiency Retrofits | All building types | Months to years | Medium to high | Long payback period; requires capital |
| Thermal Energy Storage | Commercial buildings | Hours | Medium to high | Space requirements for ice storage tanks |
Frequently Asked Questions
Why does cooling demand cause more grid stress than heating demand?
Cooling requires electricity for compressors and fans — there’s no direct fuel alternative. Heating can use natural gas, wood, or even passive solar. Cooling also peaks in the late afternoon when solar generation is declining, while heating peaks overnight when demand is otherwise low. That timing mismatch makes cooling demand harder to balance.
What is a heating degree day and how is it calculated?
A heating degree day (HDD) is the number of degrees that a day’s average temperature falls below 65°F. If the average is 50°F, that’s 15 HDD. Cooling degree days (CDD) work the opposite way, measuring degrees above 65°F. These metrics correlate strongly with energy consumption and are used for seasonal forecasting and utility planning.
Can smart thermostats actually reduce energy demand during heatwaves?
Yes, but the savings depend on how they’re used. A smart thermostat can pre-cool a home in the morning when electricity is cheaper, then let the temperature drift during the peak afternoon hours. Studies show this can reduce cooling energy use by 8-15% without significant comfort loss. The smart system response to temperature changes is most effective when combined with time-of-use electricity rates.
How much does a 1°F temperature change affect electricity demand?
It varies by region and season. In the US summer, a 1°F increase can raise peak demand by 0.5-1.5 GW nationally — enough to power a medium-sized city. The effect is larger at the extremes because more buildings are running AC, and each degree pushes them to run longer and harder.
Will renewable energy solve the cooling demand problem?
Renewables help, but they don’t solve it alone. Solar generates well during the midday hours when cooling demand rises, but the peak often extends into the evening. Wind is variable. Batteries and demand response are essential to bridge the gap. Without storage, a grid with high renewable penetration still needs fossil backup for evening peaks.
What This Means for You
- Temperature shifts are the single largest driver of short-term electricity demand volatility. Expect bigger bill swings as extreme weather becomes more common.
- Cooling demand now exceeds heating demand in most US regions. That’s a structural change that affects grid planning, fuel prices, and your summer electricity costs.
- Heatwaves in 2026 caused coal generation to rise in several markets, despite the long-term clean energy trend. The grid still relies on fossil fuels for peak demand.
- Dynamic pricing and demand response programs can cut peak demand by 10-20%. If your utility offers them, enrolling is usually worth it.
- A smart thermostat with weather-based scheduling is one of the cheapest ways to reduce your own peak demand. The Google Nest Thermostat is a solid option, and you can check its current price on Amazon.
- Low-income households bear a disproportionate share of climate-driven energy costs. Support efficiency programs and price protections in your community.
- Storage and building efficiency are the two most effective long-term solutions for managing temperature-driven demand. Both are becoming more affordable every year.
The relationship between temperature and energy demand isn’t going to get simpler. But with the right tools and planning, it’s manageable. Start with what you control — your own home, your own thermostat, your own energy habits. Then push for the bigger changes that will make the grid more resilient for everyone.

I am a mechanical engineer and love doing research on different home and outdoor heating options. When I am not working, I love spending time with my family and friends. I also enjoy blogging about my findings and helping others to find the best heating options for their needs.
Related guides
How Temperature Changes Disrupt the Carbon Cycle
You know the carbon cycle from school textbooks. It's that neat diagram showing plants absorbing CO2, animals breathing…

How Temperature Changes Supercharge Storm Surges
You watch the forecast. A hurricane is coming, and the wind speed looks bad but survivable. Then the…

How Temperature Changes Impact Crop Yields and Farm Profits
Temperature significantly influences agricultural productivity by affecting crop growth rates, yield potential, and pest dynamics, impacting overall food…