You step outside and the air feels different. It’s not just a random shift; it’s the planet’s rhythm. Seasonal temperature changes shape our lives, from what we wear to how we grow our food. Understanding these patterns connects you to the fundamental forces driving our environment.
It’s more than just “summer is hot.” The dance between sun and earth creates a complex symphony of temperature range and variability. Whether you’re planning a garden, choosing a heating system, or just curious about the world, grasping these cycles is powerful. Let’s break down how and why temperatures vary by season.
Understanding Seasonal Temperature Cycles
The core driver is simple: Earth’s axial tilt. Our planet is tilted at about 23.5 degrees relative to its orbit. This tilt, not our distance from the sun, is the primary reason for the seasons. As Earth orbits, different hemispheres receive more direct sunlight for part of the year. This creates the annual temperature cycle we all experience.
Think of it as a spotlight. When the Northern Hemisphere is tilted toward the sun, sunlight hits it more directly. Energy is concentrated, leading to warmer average temperatures by month. Meanwhile, the Southern Hemisphere gets indirect, slanted rays. The energy is spread over a larger area, causing cooler conditions. This flip-flops every six months.
This process defines our seasonal weather patterns. The result isn’t just a single hot or cold day, but a prolonged shift in weather variability and atmospheric behavior. For a truly hands-on understanding of these local shifts, tracking your own microclimate is invaluable. A tool like the Newentor Weather Station lets you monitor hyper-local conditions, turning abstract concepts into personal data.
Key Factors Influencing Seasonal Variation
Axial tilt sets the stage, but other actors influence the final scene. These factors explain why seasonal temperature differences aren’t the same everywhere.
- Sun Angle and Day Length: Higher sun angles in summer mean more intense solar radiation per unit area. Longer days also provide more time for heating.
- Land-Water Distribution: Land heats and cools rapidly. Water has a high heat capacity, warming and cooling slowly. This creates milder seasonal swings near coasts and more extreme temperature range inland.
- Atmospheric Circulation: Global wind patterns and ocean currents redistribute heat. They can amplify or dampen the basic seasonal signal from sunlight.
- Altitude and Topography: Higher elevations are cooler. Mountain ranges can block air masses, creating starkly different seasonal climate patterns on either side.
This interplay answers questions like why are summers hotter than winters at a fundamental level. It’s not just about more sun, but more effective sun over longer periods. The contrast defines the annual thermal variation for any given location.
Temperature Patterns Across Climate Zones
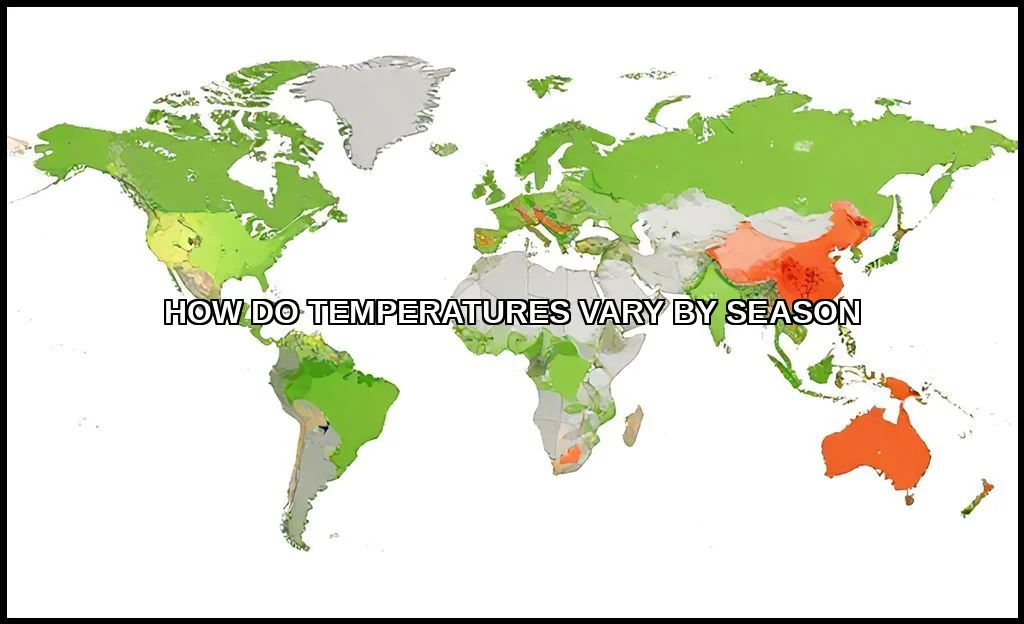
Globally, these factors combine to create distinct climate zone behaviors. Each zone has a signature pattern of temperature fluctuations.
Tropical Zones
Located near the equator, these areas experience minimal seasonal temperature differences. The sun’s angle remains high year-round. The primary cycle is often between wet and dry seasons, not hot and cold. Temperature range from month to month is remarkably small.
Temperate Zones
This is where most readers experience pronounced four-season cycles. Think North America, Europe, and parts of Asia. Monthly temperature averages show a clear sinusoidal wavea smooth rise and fall. Summers are warm, winters are cold, and springs/autumns are transitional. The exact how much does temperature change between seasons depends heavily on continental or maritime influences.
Polar Zones
Here, the effect of axial tilt is most dramatic. Polar regions experience months of continuous daylight (midnight sun) and months of darkness. This leads to extreme seasonal climate change. Temperature range can be staggering, from just below freezing in summer to profoundly cold in winter.
Understanding your climate zone is key to anticipating needs. For instance, knowing your local annual temperature cycle helps in choosing efficient home systems. You can evaluate the pros and cons of different heaters with your specific seasonal swings in mind.
Measuring and Interpreting Temperature Data
We talk about “temperature,” but which one? Daily high? Overnight low? The average of the two? Scientists use specific metrics to quantify seasonal weather patterns.
- Daily Mean Temperature: (High + Low) / 2. The standard for daily records.
- Monthly Average Temperature: The mean of all daily means for that month.
- Temperature Range: The difference between the highest and lowest temperatures over a period (daily, monthly, annual).
- Normals: A 30-year average of parameters like temperature. This smooths out year-to-year noise to reveal the underlying climate.
This distinction between climate vs weather is critical. Weather is the day-to-day state; climate is the long-term average of weather. A cold snap in April is weather. The consistent warming trend from April to July is part of the climatic annual temperature cycle. For reliable data, always refer to an official source like NOAA.
The Role of Data in Seeing Patterns
When you plot monthly temperature averages on a graph, the story becomes clear. You see the lag between the longest day (summer solstice) and the hottest month (often July or August). This “seasonal lag” happens because the ground and oceans take time to absorb and release heat. It’s a perfect example of seasonal climate change in action, not to be confused with long-term global climate change.
Regional Examples and Comparisons
Let’s make it concrete. How do temperatures vary in different climate zones? Look at these contrasts.
| City (Climate Zone) | Summer Avg. High | Winter Avg. Low | Annual Temperature Range |
|---|---|---|---|
| Singapore (Tropical) | 88F (31C) | 75F (24C) | 13F (7C) |
| New York (Temperate) | 84F (29C) | 26F (-3C) | 58F (32C) |
| Yakutsk, Russia (Polar) | 66F (19C) | -42F (-41C) | 108F (60C) |
This table starkly illustrates seasonal temperature differences. Singapore’s consistency, New York’s clear four-season wave, and Yakutsk’s extreme continental swing. What causes seasonal temperature variations at these locations? For Yakutsk, it’s deep continental interior plus high latitude. For New York, it’s a mix of continental and some maritime influence.
These variations directly impact technology choices. A region with mild winters but high humidity has different needs than a dry, frigid zone. It’s why researching whether a brand like Bradford White is good for your home depends on understanding these local thermal stresses.
Observing Trends and Anomalies
Beyond averages, we now track anomalieshow a given month deviates from its historical normal. This analysis reveals the fingerprints of broader global patterns and long-term shifts. It moves the conversation from simple weather variability to a deeper understanding of system change.
The rhythm of the seasons is a direct conversation with our planet’s orientation and composition. You feel it in the chill of a fall morning and the heat of a summer afternoon. This annual thermal variation structures ecosystems, agriculture, culture, and our daily lives.
By understanding the “why” behind seasonal climate patterns, you read the environment more clearly. You make better decisions, from planting schedules to home energy investments. It transforms a simple weather report into a chapter of a much larger, beautifully predictable planetary story. Keep observing, keep tracking, and you’ll see the pattern everywhere.
