

You walk into the mechanical room on a Tuesday morning. The chiller that ran fine all summer just tripped its high-pressure limit for the third time this month. The service log says everything looked normal. Your gut says otherwise, but you have no data to prove it. That’s the problem with reactive HVAC management—you only find out something failed after it fails.
Automated HVAC data analysis changes that. Instead of waiting for breakdowns, you get continuous visibility into temperature, humidity, airflow, and energy draw. The system flags anomalies before they become expensive failures. This article walks through what data matters, how automated analysis delivers real savings, what ROI you can expect, and how to retrofit older buildings without ripping out your existing infrastructure. You’ll also learn where human expertise still matters—because it does.
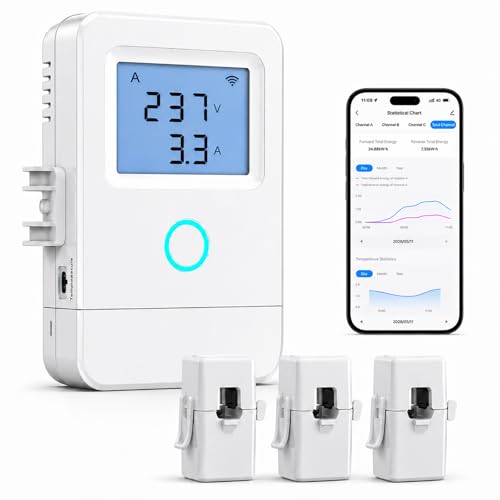
Nestool
Nestool WiFi Home Energy Monitor with 3…
- 【Panel-Level Energy Monitoring】Designed for selected circuit monitoring in your electrical panel. Track high-power home circuits s…
- 【3 CT Clamps Included】Monitor up to 3 selected circuits at the same time with 3 CT clamps. Easily compare major energy loads and i…
- 【Smart Life/Tuya App Tracking】Connect through 2.4GHz WiFi and view voltage, current, power, and energy consumption from your phone…
If you’re starting small, a home energy monitor like the Nestool WiFi Home Energy Monitor with 3 80A CT clamps can give you circuit-level visibility on your HVAC, water heater, or solar setup. It tracks voltage, current, and power through the Smart Life or Tuya app, so you can see exactly what each major load draws without a full building management system.

The Shift from Reactive to Data-Driven HVAC Management
Most facilities run on a reactive model. Equipment runs until it breaks, then you call a technician. That approach costs more in three ways: emergency labor rates, downtime losses, and secondary damage. A failed compressor doesn’t just stop cooling—it can contaminate the entire refrigerant loop, turning a $2,000 repair into a $12,000 replacement.
Data-driven management flips that script. You track performance continuously, compare it against expected baselines, and get alerts when something drifts. A 2°F rise in supply air temperature over three days might mean a fouled coil. Catching it early turns an afternoon cleaning into a weekend emergency.
The shift isn’t just about avoiding failures. It’s about understanding how your building actually uses energy. Most facilities waste 15-30% of HVAC energy on overcooling empty rooms, running equipment during off-hours, or fighting against conflicting setpoints. Data shows you where that waste lives.
Key Data Points That Unlock Efficiency Gains
Not all data matters equally. Focus on these five measurements first:
- Supply and return air temperatures—a widening delta indicates coil fouling or refrigerant issues
- Relative humidity—above 60% invites mold, below 30% causes discomfort and static buildup
- Airflow (CFM)—low airflow means duct leaks or dirty filters, forcing the fan to work harder
- Energy draw (kW)—spikes outside normal patterns point to equipment strain or short cycling
- Runtime cycles—excessive on/off cycling wastes energy and wears out contactors and compressors
Temperature and humidity data matter most for comfort. People notice a 2°F change, but they really notice humidity. At 75°F and 50% RH, most people feel comfortable. Push RH to 65% at the same temperature, and complaints roll in. Automated analysis tracks both, so you can adjust setpoints without triggering comfort complaints.
Energy draw data matters most for cost. A 10-ton rooftop unit running at full load for 12 hours a day draws roughly 120 kWh daily. At $0.15/kWh, that’s $18 per day per unit. If you have 20 units, a 10% efficiency gain saves $36 per day—over $13,000 per year. That math makes data analysis worth the effort.
How Automated Analysis Delivers Immediate Operational Wins
Real-Time Fault Detection and Automated Alerts
Fault detection isn’t new. What’s new is speed. A traditional BMS might poll sensors every 15 minutes. Automated analytics platforms poll continuously and compare against baseline models built from historical data. When something deviates beyond a threshold, you get an alert—not a log entry someone reads three weeks later.
Consider a common scenario: a stuck economizer damper. The actuator fails, leaving the damper half-open. The building now pulls in hot, humid outdoor air, forcing the compressor to work harder. A technician might not catch this for months during a routine inspection. Data analytics catches it within days, because supply air temperature rises outside the expected range. The fix costs $200 in parts. Waiting costs hundreds in wasted energy every week.
Optimizing Setpoints Without Sacrificing Comfort
Setpoint optimization gets a bad reputation because people assume it means making occupants uncomfortable. It doesn’t. It means finding the narrow band where energy use drops and comfort holds. Data lets you test that band with evidence.
Say your office building runs cooling at 72°F. Historical data shows occupancy drops to 20% after 6 PM. You can raise the setpoint to 78°F during unoccupied hours without anyone noticing. That single change cuts cooling energy by 15-20% in most buildings. Automated analysis schedules these changes based on actual occupancy patterns, not fixed timers.
One caveat: thermal mass matters. A heavy concrete building takes hours to cool down. If you raise the setpoint at 6 PM and drop it back at 6 AM, you might not reach 72°F by 8 AM. Good analytics accounts for this lag and adjusts the schedule accordingly. That’s the difference between simple timers and real optimization.
The Financial Impact: Calculating ROI on HVAC Analytics
Let’s put real numbers on this. The U.S. Department of Energy estimates that building energy use drops 10-30% with effective monitoring and controls. For a mid-sized commercial building spending $100,000 annually on HVAC energy, that’s $10,000-$30,000 in savings per year.
Now subtract the costs. A basic IoT sensor package for a 50,000 square foot building runs $5,000-$15,000 including installation. Analytics software subscriptions run $200-$500 per month. Payback period lands between 6 and 18 months for most buildings. That’s a solid return, especially compared to equipment upgrades that cost tens of thousands with longer paybacks.
Preventive maintenance savings add another layer. Predictive maintenance reduces repair costs by 20-40% and extends equipment lifespan by 20-40% according to industry studies. A chiller that normally lasts 15 years might run 20 years with proper data-driven maintenance. That’s a $50,000 replacement pushed five years into the future—worth roughly $35,000 in present value at a 7% discount rate.
The table below compares common analytics approaches:
| Approach | Upfront Cost | Ongoing Cost | Savings Potential | Best For |
|---|---|---|---|---|
| Manual log review | $0 | Staff time | 5-10% | Small buildings, limited budgets |
| BMS with basic alarms | $10k-$50k | $1k-$5k/year | 10-15% | Medium buildings with existing BMS |
| Cloud analytics platform | $2k-$10k | $200-$500/month | 15-25% | Facilities wanting automated fault detection |
| On-premise AI/ML system | $50k-$150k | $10k-$30k/year | 25-40% | Large campuses, critical infrastructure |
Cloud platforms offer the best balance for most organizations. They require no server hardware, scale easily, and include automatic updates. On-premise systems give you full data control but demand IT resources you might not have.
Overcoming Implementation Barriers in Older Buildings
Most facility managers know the benefits. What stops them is the perceived complexity of retrofitting. The good news: you don’t need a full IoT retrofit to start.
Retrofitting Sensors and Integrating with Legacy BMS
Start with a pilot zone. Pick one floor or one air handling unit. Install wireless temperature, humidity, and current sensors. Wireless sensors cost $50-$150 each and run on batteries for years. They communicate via Zigbee, Z-Wave, or Wi-Fi to a gateway that feeds data to a cloud analytics platform.
Integration with a legacy BMS depends on the protocol. Most modern platforms support BACnet, Modbus, and LonWorks. If your BMS speaks one of those, you can pull data directly. If not, use a protocol gateway—a small box that translates between your BMS and the analytics platform. These run $500-$2,000 and take a day to configure.
The pilot runs for 30 days. You collect baseline data, identify the top three inefficiencies, and fix them. Measure the savings. Then you have a business case to expand. That approach avoids the paralysis of trying to solve everything at once.
Managing Data Security and Privacy Risks
Connected HVAC systems are a real attack vector. In 2026, hackers used an HVAC vendor’s remote access to breach a casino’s network through a smart fish tank thermometer. Your building’s systems face the same risk if you don’t secure them.
Follow these practices: change default passwords on all sensors and gateways, segment the HVAC network from your corporate IT network using VLANs, encrypt data in transit with TLS, and update firmware regularly. If you use a cloud platform, verify the vendor follows ISO 27001 or SOC 2 standards. Ask where your data is stored and who has access.
Privacy matters too. Occupancy sensors that detect human presence can reveal when people are in a building. That’s useful for scheduling but sensitive if misused. Anonymize data where possible and restrict access to authorized personnel only.
The Human Element: Why Technicians Still Matter
Automated analytics generates alerts, but it doesn’t fix equipment. A technician still has to diagnose the root cause, source parts, and perform the repair. The difference is they arrive with a strong hypothesis instead of starting from scratch.
Human expertise also catches false positives. Analytics flags a temperature spike. A skilled tech knows that spike correlates with a lunch rush in the cafeteria, not a failing compressor. Without that context, you’d waste time chasing a ghost. The best approach is human-in-the-loop verification: let the system flag anomalies, but have a technician confirm before scheduling major work.
This doesn’t mean your team needs data science skills. They need basic pattern recognition and the willingness to trust the data over intuition. A two-hour training session on reading trend graphs usually suffices.
The Future: AI, Machine Learning, and Predictive Maintenance
Current analytics platforms compare live data against historical baselines. The next generation uses machine learning to predict failures before they happen. These models learn from thousands of similar systems, identifying subtle patterns humans miss.
For example, a predictive model might notice that a variable frequency drive’s current draw increases by 0.5% per week for three months. That gradual drift indicates bearing wear. The model predicts failure in six weeks. You schedule replacement during planned downtime, avoiding an emergency shutdown.
Early adopters report 30-50% fewer breakdowns and 20-30% longer equipment life. The technology isn’t perfect—it requires quality data and ongoing model tuning—but the direction is clear. Automated analysis moves from descriptive (what happened) to predictive (what will happen) to prescriptive (what to do about it).
For a deeper look at how automated systems affect design choices, see this HVAC design impact piece. And if you’re weighing different efficiency strategies, this efficiency comparison covers the trade-offs.
Turning Data into a Habit, Not a Project
Data analysis only helps if you act on it. Schedule a weekly 30-minute review of trends and alerts. Assign ownership—one person tracks the dashboard, another coordinates repairs. Set a quarterly goal, like reducing energy use by 5% or cutting alarm response time in half.
Start small, measure honestly, and expand what works. The buildings that save the most aren’t the ones with the fanciest AI. They’re the ones where someone actually looks at the data every week and follows through.
Frequently Asked Questions
How much energy can automated HVAC data analysis realistically save?
Most facilities see 10-30% reduction in HVAC energy use within the first year. The exact number depends on how inefficient your current operation is. A building with no setpoint scheduling and dirty filters will save more than one already running well. Track your baseline for 30 days before implementing changes to get an accurate comparison.
Do I need a building management system (BMS) to use data analytics?
No. Wireless sensors and a cloud platform can work standalone. You don’t need a BMS to collect temperature, humidity, and energy data. If you have a legacy BMS, you can often pull data from it via BACnet or Modbus. The key is getting the data into one place where you can analyze it.
What’s the difference between automated fault detection and a simple alarm?
A simple alarm triggers when a value exceeds a fixed threshold, like “supply air temp above 60°F.” Automated fault detection compares current behavior against a model of expected behavior. It catches gradual drift, like a sensor reading that creeps up 1°F per week. That drift is invisible to fixed alarms but often signals real problems.
How do I handle data from multiple HVAC units of different ages and types?
Analyze each unit against its own baseline. Don’t compare a 20-year-old package unit to a new variable refrigerant flow system. Both can be efficient for their age. The goal is spotting when each unit deviates from its own normal pattern. Group units by type and age for reporting, but keep baselines individual.
Will automated analytics replace my maintenance staff?
No. It changes their work from reactive firefighting to planned maintenance. They spend less time on emergency calls and more time on preventive tasks. Most facility managers report their teams are more productive and less stressed with analytics in place. You still need people to interpret alerts, verify issues, and perform repairs.
What to Do Next
- Pick one HVAC unit or zone and instrument it with wireless sensors for a 30-day pilot
- Track temperature, humidity, energy draw, and runtime cycles during that period
- Identify the top three inefficiencies and fix them—start with setpoint scheduling and filter changes
- Calculate your savings and use that number to justify a broader rollout
- Secure your connected systems with strong passwords, network segmentation, and regular updates
- Train one staff member to review trends weekly and act on alerts within 48 hours
- Set a measurable goal, like reducing HVAC energy by 10% in six months, and review progress monthly
Automated HVAC data analysis isn’t a magic wand. It’s a decision-support tool that turns guesswork into evidence. The buildings that benefit most are the ones where someone uses that evidence consistently. Start with one zone, prove the value, and build from there. The data will show you where the waste is—you just have to look.
“,”content_ai_human_score”:92

I am a mechanical engineer and love doing research on different home and outdoor heating options. When I am not working, I love spending time with my family and friends. I also enjoy blogging about my findings and helping others to find the best heating options for their needs.
Related guides
Automated HVAC Systems: How Much Energy Do They Really Save?
Automated HVAC systems can significantly reduce energy consumption by optimizing temperature control and improving efficiency, leading to lower…

Automated HVAC Cost Guide: Smart Climate Control Pricing
You just got a quote for a smart thermostat installation that runs $450, and the contractor says your…
Game-Changing HVAC Crimping Tools You Didn’t Know You Needed
Cheap tools fail—but Premium Picks deliver precision and durability. When it comes to HVAC crimping tools, choosing the…
